 Evolution
 Intelligent Design
BIO-Complexity Presents Better Model than Common Ancestry for Explaining Pattern of Nature
One of the central pillars of the standard evolutionary model is the belief that all living species evolved from a common ancestor through a gradually unfolding tree of life. As a result, the pattern of similarities and differences in species today is believed to fit into a tree-like pattern or nested hierarchy where branching points correspond to the appearance of new traits. For instance, all mammals share certain characteristics, such as producing milk, since their most recent common ancestor first evolved those traits, and the traits carried through each evolving branch of the tree. This iconic tree of life has been presented to the public as one of the strongest pieces of evidence for the development of life progressing entirely through undirected natural processes. However, many aspects of this story have been contradicted by major discoveries over the past several decades.
Of primary importance, the first representatives of most major groups of organisms appeared suddenly in the fossil record without identifiable sequences of intermediates leading back to a common ancestor with other groups. Equally problematic, the pattern of physical traits and molecular sequences in species throughout nature do not imply a consistent evolutionary tree. For instance, the eyes of humans and octopi are quite similar, but the two groups are believed to be only distantly related. Highlighting this challenge, an older article analyzed across several studies the percentages of characteristics for given groups of species which fit consistently with the best constructed cladograms (approximations to an evolutionary tree). These percentages known as “consistency indices” were then plotted on the same graph as those derived from randomly generated data, and the indices were then adjusted to remove the effect of random noise. The average for the adjusted indices resided somewhere around 0.35. More recent attempts to construct cladograms for various groups have fared no better, such as with Euarchonta (group including primates) and Therapsids (proposed ancestors to mammals). In other words, roughly two-thirds of all data do not fit the common ancestry model.
Disappointing Results, Ad Hoc Mechanisms
These disappointing results have required evolutionists to devise several ad hoc mechanisms to explain the ubiquitous inconsistencies. Examples include lateral gene transfer (LGT), differential gene loss, and convergent evolution. Yet, the widescale appeal to LGT has been seriously questioned. And the claim that complex adaptations can appear independently multiple times (convergent evolution) collapses on close examination due to the implausibility for their appearing through undirected processes even once.
For instance, eyes with lenses are believed to have evolved independently multiple times, but all scenarios face insurmountable barriers in terms of opposing selective pressures and required time scales. Even more striking, the purported convergent evolution of echolocation in bats and dolphins involved the same sequence modifications in over 200 regions of their DNA. Yet, the time available for a terrestrial mammal to evolve into a fully aquatic marine animal is insufficient for acquiring even two new coordinated mutations, and the transformation to aquatic mammals required many additional modifications. Despite these challenges, evolutionists have maintained that common ancestry is still the best explanation for the data since it does to some extent fit a tree-like pattern. That claim now faces a formidable challenge from a recent paper in the journal BIO-Complexity, by Winston Ewert. He persuasively presents a new framework for better explaining the pattern of nature.
A New Framework
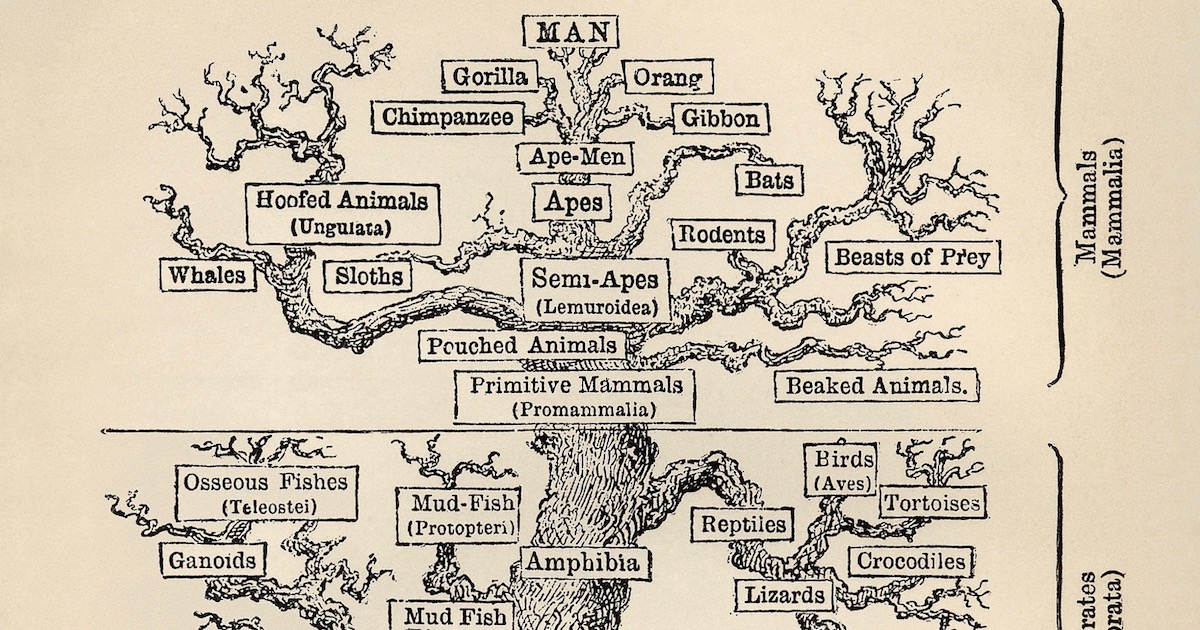
Ewert’s model interprets the pattern of similarities in different groups of species as fitting into what are referred to in computer science as dependency graphs. Specifically, programmers do not usually write new programs entirely from scratch. Instead they reuse standard modules. One example is the JavaScript module request, which downloads files from the Internet. Modules typically access other modules, forming a branching network of dependency relationships (see Figure 1).
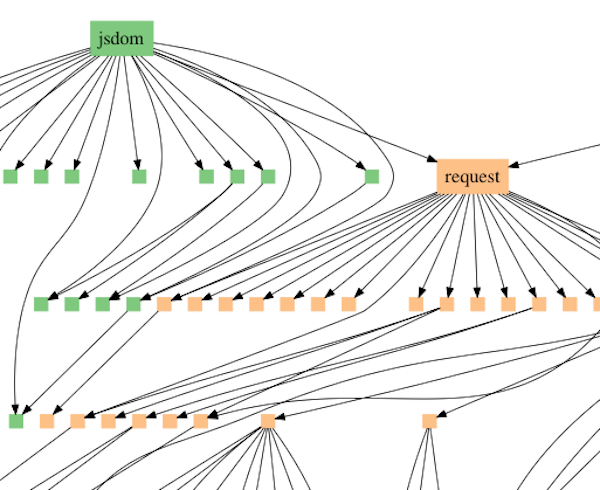
Figure 1: Dependency graph illustrating the module jsdom accessing the module request which accesses other modules. Request is also accessed by other higher-level modules.
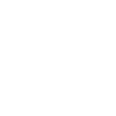
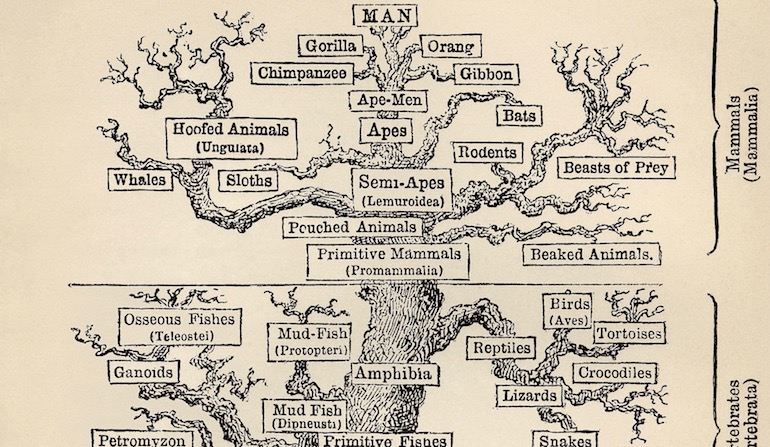
Dependency graphs often include a nested hierarchy as part of their structure, but they also contain additional relationships that extend beyond a simple tree. The difference can be seen by comparing the standard mammalian tree of life (Figure 2) based on common descent with a dependency graph derived from the same species (Figure 3).
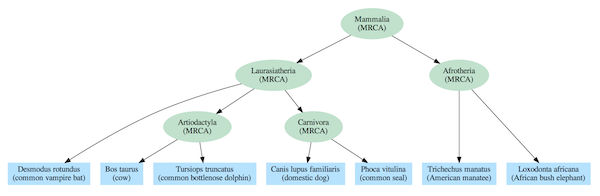
Figure 2: Tree of life for select mammal species. Every set of species at a given level in the nested hierarchy has only one most recent common ancestor.
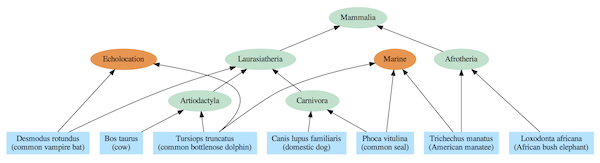
Figure 3: Dependency graph for select mammal species. A single species can depend on multiple modules.
The evolutionary tree model requires, at least for complex life, that every species link back to a single most recent common ancestor (MRCA) with other species in the same group (clade). For instance, elephants and manatees are both members of the Afrotheria clade, so they are depicted as having a MRCA that was that clade’s first representative. And, each MRCA links back to a single MRCA for all members of clades at higher levels in the hierarchy. For instance, the MRCAs of the Artiodactyla and Carnivora clades share a single MRCA with all members of the Laurasiatheria clade. And all mammal species link back to a single MRCA that is the trunk of the Mammalia tree of life.
The corresponding dependency graph includes the same nested hierarchy as the purported evolutionary tree, but the relationships are interpreted not in terms of MRCAs but in terms of shared modules. For instance, elephants and manatees both use the Afrotheria module, and all mammals use the Mammalia module. Yet, in stark contrast to the common ancestry model, manatees, seals, and dolphins all use the marine module which is incongruent with the evolutionary tree. Likewise, bats and dolphins both use the echolocation module, while in the common ancestry model they are not closely related.
Comparing Two Models
Ewert compared the predictive power of the dependency graph and common ancestry models by analyzing the distribution of gene families in different collections of species taken from nine different databases. For each database, a set of genes used by multiple species was identified as a module upon which those species depend. And a set of genes contained in multiple larger modules was identified as a distinct module upon which the larger modules depend. An optimization routine was used to construct an approximation to the best dependency graph, and that graph was compared to the tree of life as presented by the NCBI database hierarchy. The better fit for the data was then determined between the two representations using Bayesian model selection.
The dependency graph model makes several predictions that are in direct opposition to the common ancestry model:
- Biological data should fit a dependency graph better than a tree.
- Data produced by a process dominated by common descent or branching should fit a tree better than a dependency graph.
- Inferred graphs for biological data should contain many more non-taxonomic modules with many more genes than dependency graphs inferred from data known to have been produced by common descent.
- Software should fit a dependency graph better than a tree, but a tree better than a null model. A null model corresponds to no pattern existing for the reuse of gene families across species.
Ewert’s analysis validated all of these predictions with high statistical confidence for all databases. Therefore, this initial study suggests that the dependency graph model greatly surpasses the common ancestry model for understanding the pattern of nature.
As a consequence, all purported evolutionary trees and sequences become highly suspect, including such icons as the whale and human series. For they are based on similarities of traits between species, and similarities are an unreliable indicator of common ancestry as implied by the trees’ typically low adjusted consistency indices. Instead, similarities appear to be the result of a designer reusing design modules in different species to meet common goals.
Ewert’s article represents only the first step in evaluating and developing his framework. Still, the significance of this research cannot be overstated. The dependency graph model explains why subsets of the biological data crudely fit a tree pattern and why so much of the data is incongruent. It also makes clear predictions on the results of future studies on the distribution across species of both physical traits and similarities in molecular data. Finally, it should lead to a robust and innovative research program based on the intelligent design framework.
Image: A traditional Tree of Life, via Wikimedia Commons.